
Market breadth can provide important clues about what and importantly who is driving the market.
A longstanding measure to evaluate the breadth of the market was created by Richard Arms going on 50 years ago.
TRIN is short for TRading INdicator and is used to highlight overbought and oversold levels in the market. Also called the ARMS index for its author, the TRIN is a tool to identify extremes. The TRIN is often used to identify divergence from price. New highs or lows without TRIN confirmation could be a sign of a trend change.
For example, a few select FANG stocks (Facebook, Amazon, Netflix and Google) had extraordinary performance and pushed tech shares to record levels in the past year. Their extreme gains in 2015 distorted market measures as those big boys overcompensated for lesser achievers.
That lack of market breadth was even more apparent in the broad market barometer S&P 500 that finished the year essentially unchanged. Without FANG, the bite would have been much more painful.
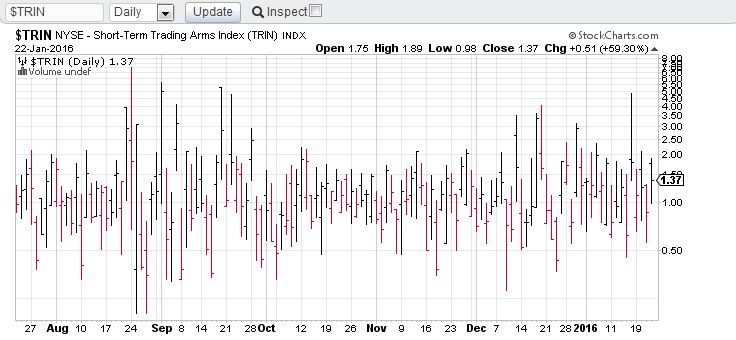
The measure methodology is to find the true internal strength or weakness by comparing the ratio of advancers to decliners. To further dial down on the actual drivers, the advancing volume is compared to declining volume.
Here’s a formula to help illustrate the concept:
TRIN = (Advancing Issues/Declining Issues)/ Advancing Volume/ Declining Volume
A TRIN above 1 is bearish and oversold with a TRIN below -1 is bullish and overbought.
This is a sentiment measure as opposed to the market price itself can illustrate what is happening with the breadth of direction and volumes. Most analysts use this formula (and TRIN charts) to look at twenty-day moving averages, but it can also be useful for daily predictions. A simple market breadth measure in the TRIN puts perspective on price.
As with any technical indicator there are no absolutes. It’s simply used as a data point in numerous computerized trading programs. Nevertheless, keeping an eye on the TRIN can help you with some predictions.