
Understanding the big or macro picture is critical to positioning. It’ll help you see where the big money is flowing and if risk levels are favorable to equities or other asset classes.
We have all heard of bullish and bearish or “risk on / risk off” indicators. There are many with some that look at a few simple inputs, like how many stocks are trading over their 10-day moving average in the S&P 500. Others might look at the RSI or volume. For our take on the big view, our “risk on / risk off” gauge looks at five key intermarket relationships or “ratios” to determine its values.
When looking at ratios, we are comparing two financial instruments and how they trade and move over time in relation to each other. We do this by dividing the daily closes of one instrument against another. This gives us a ratio value that will go up and down as the two instruments change in relative value. Each of the individual ratios are set up so that when the ratio is above its moving average, we are in a “bullish” condition. When the ratio is below its moving average, we are in “bearish” condition.
Today we will look at one of the most important intermarket relationships: the S&P 500 versus Utilities
SPY vs Utilities
Utility companies are typically considered one of the safer and more conservative investments because of the nature of their business. Utility companies are highly regulated. They are often immune to the extremes of market cycles because demand for their services doesn’t change significantly during market booms and busts. They also offer high and regular dividends. All of this offers a degree of safety that make them attractive investments, particularly in times of market turmoil.
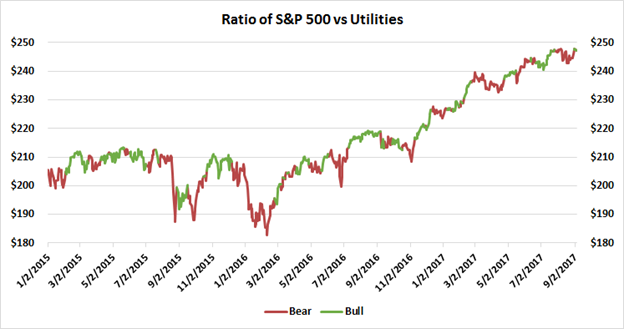
The chart above plots the bull and bear conditions of this ratio overlaid on the S&P 500 since 2015. The green portions of the chart show when the ratio was over its moving average. This indicates a bullish “risk on” condition. When the ratio is below its moving average (utilities are outperforming the SPY), we have a bearish “risk off” condition indicating the market might be in some trouble.
Final Thoughts
It easy to see that major declines occurred when the indicator was red or risk off was indicated. All major declines occurred when red or “risk off” was indicated. Conversely, almost all of the major moves to the upside occurred when the indicator showed green. Using the indicator in its basic form is effective as a market timing or asset allocation tool. At Market Gauge, we use this along with other 4 other inter-market relationships as trading models.


