It has been said that, “the single best time to buy a stock is when, given bad news, the stock refuses to go down anymore” – Justin Mamis in The Nature of Risk.
This is a simplification of what is called a positive divergence. The stock should be going down, but it does not. More specifically, a positive divergence occurs when the price action of a stock continues lower but a technical indicator improves. The technical indicator used is most often a momentum indicator such as MACD, Stochastics, RSI, etc.
Positive divergences may be signaling a bullish shift in direction. In general, the significance of the divergence increases if followed by improving technical action in the stock.
In the example below, the stock made a new low but the MACD actually made a higher low. When the stock broke above the resistance level (red line) the ensuing rally was very strong.
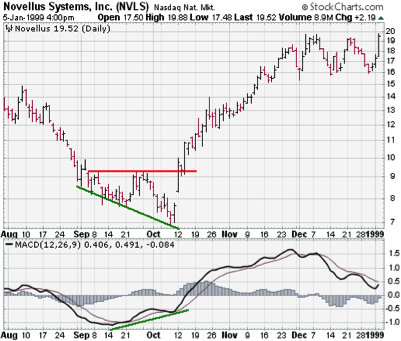
Source: stockcharts.com
In the second example, we see another positive divergence, but this time it comes from the Slow Stochastic.
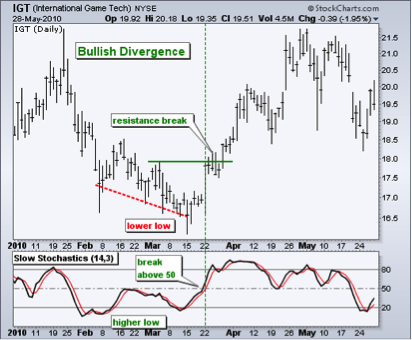
Source: stockcharts.com
What these examples are showing us is that, although the prices of the stocks were showing continued weakness, under the surface things were improving.
Investors and traders who use technical analysis should find the use of positive divergences in their decision-making process a helpful addition.