
Conventional wisdom using oscillators, such as the Stochastic or RSI, has the trader wait for confirmation after indicator turning points have occurred before placing the trade. This chart demonstrates this concept. The green arrows denote buying when the indicator crosses over the 20% level and the red arrows denote selling short when the indicator crosses under the 80% level.
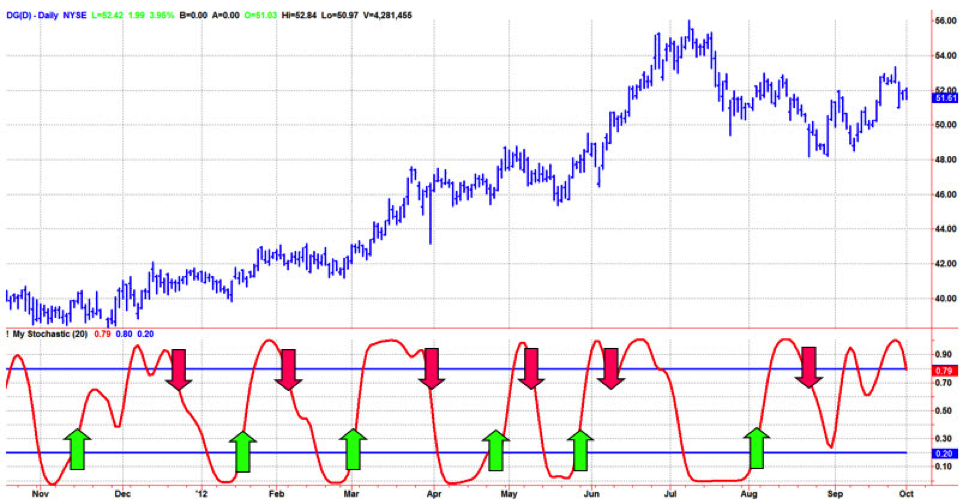
Conventional wisdom is wrong! Here’s why: Assume there is a monthly cycle in the market. That cycle period is 20 trading days. That means, in general, there are 10 bars up and 10 bars down. But there is about a 4 bar computational lag in your oscillator plus a one bar delay in making the trade after the signal plus about 3 bars of lag waiting for confirmation. That’s a total of 8 bars of lag! Eight bars of lag into a 10-day move is almost a guaranteed statistical loser.
There is a better way to use your oscillator indicators. You can anticipate the cyclic turning points, thereby expecting a reversion to the mean. The chart below demonstrates this concept. The green arrows denote buying when the indicator crosses under the 20% level and selling short when the indicator crosses over the 80% level.
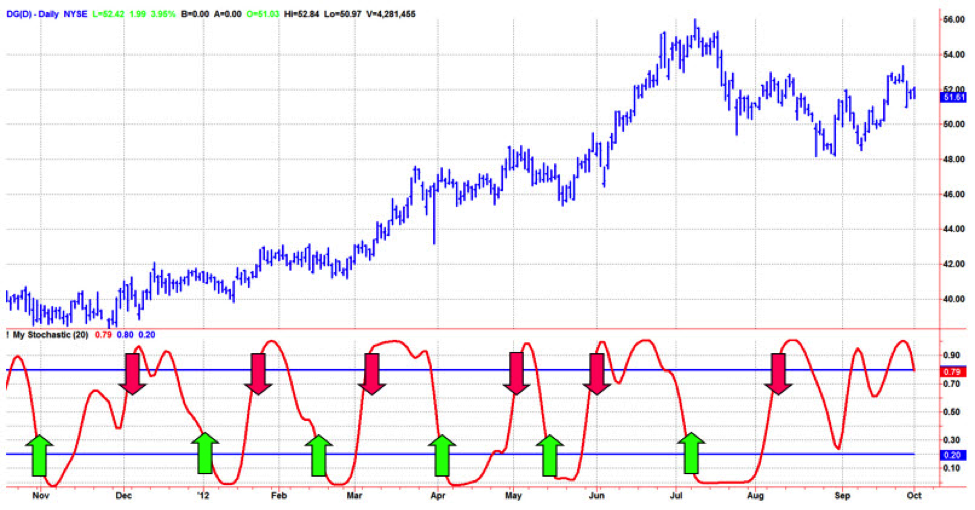
Here’s why anticipating the turning point is better: The same oscillator indicator is used, so there still is about 4 bars of computational lag and a one bar delay in making the trade after the signal. However, anticipating the turning point generally gives about a 3 bar advance of the real turning point in the indicator. Thus, the total lag in making the trade is 4 + 1 – 3 = 2 bars. The generalized two bar lag in making a trade in an expected 10 bar move produces a statistically superior performance than that produced by conventional wisdom.
Trading performance can be further enhanced by dynamically tuning the buying and selling thresholds to current market conditions. To learn how this can be done, click HERE.


