Let’s take a look at what APPL might do over earnings. AAPL’s earnings always stimulate a huge discussion and affect boatloads of people. I think the season of wild 15-20% gaps on earnings for AAPL are over and calmed down. Now that AAPL has made it to the ‘dividend paying’ portion of stocks, it’s going to be seen as more of a blue chip stock now and its estimates will likely be much more stable.
We can see this with some declined option implied volatility and thus the pricing and value of the options over earnings.
Here are my thoughts on AAPL over earnings. This will be purely a shorter term (weeks to months) perspective based on the technical charts of AAPL. Earnings are the 26th of July after market close. My guess? I think AAPL gaps up on earnings and then trades down. But of course, it’s AAPL. It could have a fantastic earnings report and gap down.
If AAPL does gap down, I’ll be interested to see the magnitude and thus the size of the gap down.
If the gap down is small, I would be excited about a small gap down and open between $98 and $96. You’ll see a small green triangle on my chart. A gap down in that range would likely represent a retest of the triangle and AAPL should pop and run bullish a few days after the gap.
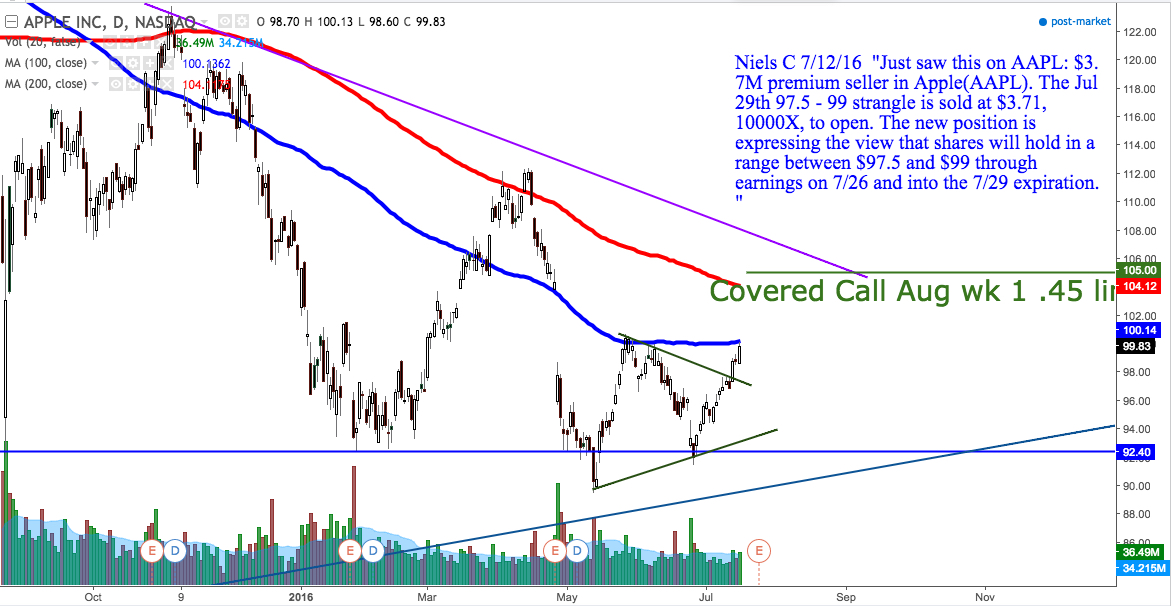
A large gap down into the $92 range will be really interesting. I mean, how many times can AAPL bounce strongly off of that support? $93.30 is the 200 simple moving average on the weekly, which is also a strong support. Will AAPL bounce again, if it gaps down that far? Maybe. That’s what I’ll be interested in playing (the bounce) with either some put sales or calls.
Regarding those who might have shares of AAPL, I really like a $105 Aug week 1 covered call, bringing in about .45 cents per 100 shares. The 200 SMA on the daily is $104.12. My thoughts are if AAPL gaps up again, in that 6-7% range, those who bought off of $92 will likely sell that gap, and it will fade and trade back down to $100, where I expect to play the bullish bounce off of $100.
That’s where the 100 simple moving average is right now. How fitting, right at $100.14 which was an incredible resistance on 7/18/16. Between now and earnings, if AAPL trades sideways a few days and then creates a small ‘normal gap up’ above $100.83, I think AAPL could run up into earnings. And then, it’s anybody’s guess. The $107 – $105 level is a brick wall of lower highs on AAPL’s weekly chart.
It kind of appears AAPL could be forming a double bottom on the weekly too. That’s why I anticipate waiting after a gap up for a possible trade down, in which I’ll be a buyer. Either way, I love AAPL long term. I would love to hear your thoughts. Feel free to message me below and tell me your trading plan! Thanks so much for reading. Until next time friends, remember – love life, live life, and trade it!


