In the aftermath of each of the most recent bear markets, we all heard talk about how folks would need to postpone retirement to rebuild their nest eggs.
Consider the following:
An investor in their 40’s has been investing religiously for the past 20 years. Since they have many more years ahead of them, and the long-term effects of inflation will eat away at their money’s buying power, they still maintain 70% or more of their portfolio in stocks.
The market enters a bear phase and the equity portion declines by 40+%. Even with a 30% allocation to low-risk investments, the entire portfolio is now down 28-30%.
Did you know that in order for this investor to get back to even, the entire portfolio has to gain upwards of 43%, and the stock portion alone 65%+?!
It’s called the mathematics of losing and it’s one of the most insidious hidden risks of investing.
If you have $200,000 in an S+P Index Fund and the market corrects 50%, you’ll now have $100,000. True, you need to make back the $100k to get to even, but this is a 100% gain on the remaining capital, not 50%. If the market then returns to an average annual return of 9%, it would take 8 years for you to get back to $200,000.
The table below shows you the performance needed to get back to even, under various loss scenarios:
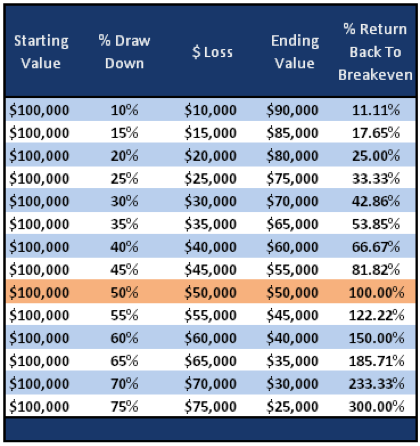
(source: investing.com)
Fortunately, it is often the case that the market achieves a return greater than its historical average.
According to Mark Hulbert,
…the recovery from the recession of 2008-09, which many consider being the worst since the 1930s. By January 2013, the stock market’s inflation-and-dividend-adjusted level had risen back to where it stood at its October 2007 peak. That was just over four years after the bear market’s bottom in March 2009, and a little more than six years from the market’s pre-bear-market level. The longest recovery time since the mid-1920s was from the 1973-74 bear market: It wasn’t until December 1984 that the inflation-and-dividend-adjusted level of the stock market was back to where it stood in January 1973. But a big contributing factor to that lengthy recovery was that era’s double-digit inflation, and one could argue that inflation is unlikely in coming years to be as big a headwind for equities.
Below is Craig Israelsen’s study from 2009 that used historical market returns to calculate your odds of recovering from a portfolio loss over a specified time frame:
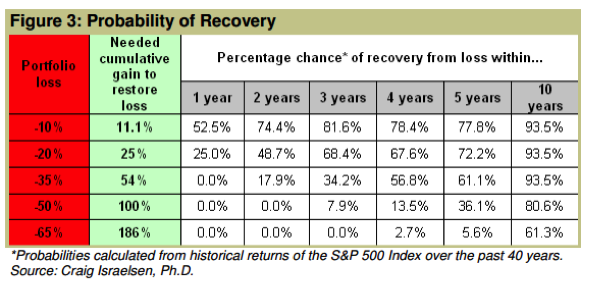
Understand where your risks are, the potential impact of those risks, and strategies that may address them.