Investors and traders use technical indicators in an attempt to obtain more information than just observing price. The speed, momentum, and volume of movement can provide additional clues to what the future may hold.
One of the most commonly used indicators is the MOVING AVERAGE.
A moving average is exactly that, a mean for a distinct time period with old data dropped off for new information as it comes in. This function is designed to smooth out volatility and provide a performance picture of the price.
To calculate the simple moving average, just add together the closing prices and divide by the number of periods.
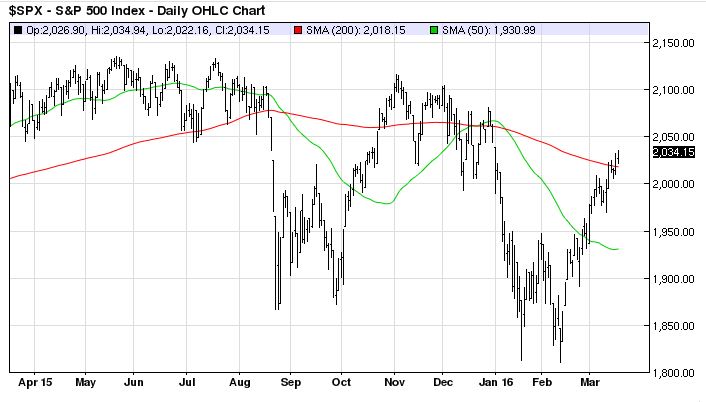
The 200-day moving average is used to identify the long-term trend. A climb or decline through that line determines the BULLISH or BEARISH bias.
Trend followers can use it to put themselves on the right side of the market in an attempt to go with the flow. Take caution though, 200 days is nearly one year of trading data that may be slow to catch up to short term events.
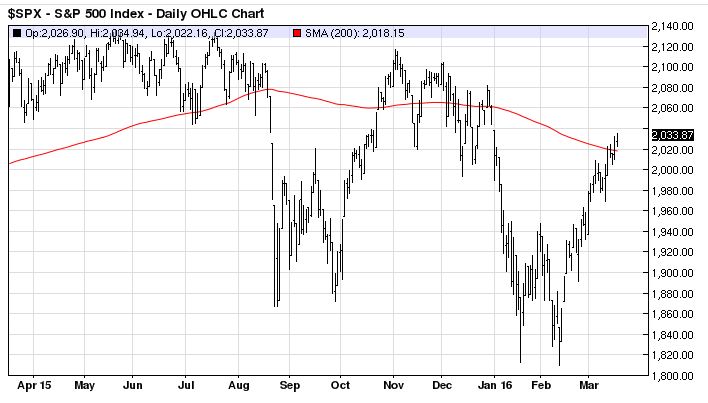
Only valuable for a larger perspective, the 200-day moving average is a pivot point breached rarely. Though it is a major support or resistance level to monitor, a new crossover can be weeks or months away.
The 50-day moving average is a more medium term indication of the price trend. The sensitivity is increased with about two calendar months of price information.
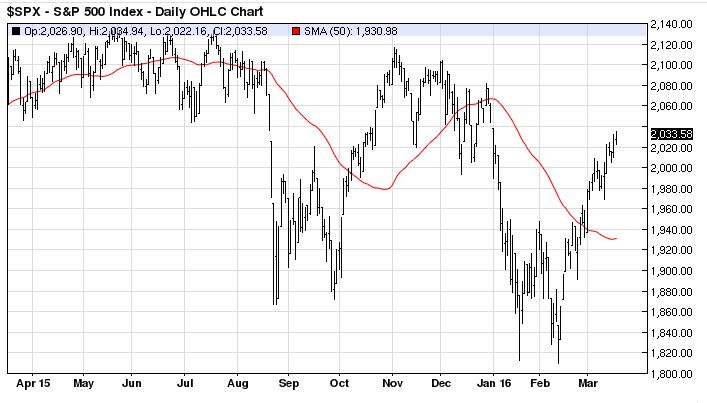
When markets move sideways like the S&P 500 April to August, shorter-term moving averages may not provide a clear price picture with constant crossovers.
The combination of the 200-day and the 50-day moving averages produces the Bullish Golden Cross and the Bearish Death Cross.
Golden Cross – 50-day crossing above the 200-day MA
Death Cross – 50-day crossing below the 200-day MA
It’s possible to take both the golden cross and the death cross as confirmation of a change in trend, whether signaling an upward turn in price or downturn in a market. Use this tool along with our other shortcuts to make accurate trading decisions.