Price chart patterns are a mainstay for technical traders looking to forecast future moves. These distinct formations on a stock chart shows signs of future price movements. Knowing a few basic formations will help you identify opportunities for profit and the potential price target by understanding current trends and trend reversals.
Here are two patterns you need to be aware of. Stay tuned for part two where we discuss more chart patterns.
Flag Pattern
One of the most common chart formations is a flag pattern. Two types of flags exist and both suggest the continuation of the price trend. The flag pattern is rectangular while the pennant is triangular.
The consolidation of prices contained within a price range lets the chart flag fly. Parallel lines of support and resistance are often opposite of the original price direction.
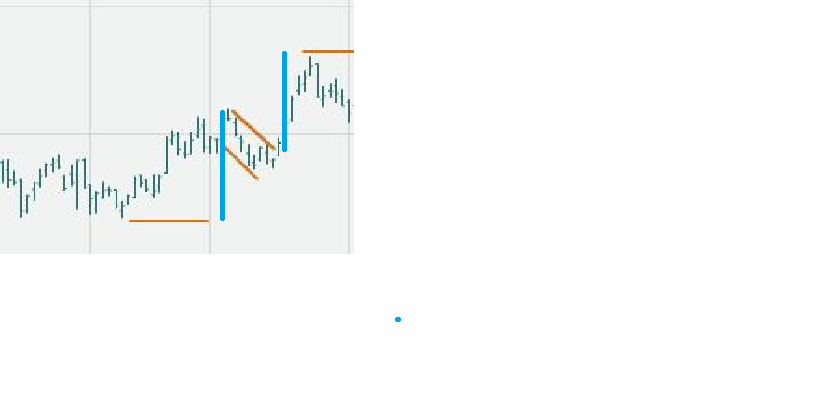
A buy or sell signal occurs on a breakout of that flag support or resistance to continue the overall price trend. Increasing volume is an also an important component to demonstrate renewed momentum after the stall that formed the flag.
The blue line represents the flagpole formed by price base to flag. The measured move target is the distance of the flagpole plus/minus the flag breakout.
The Cup And Handle Pattern
A often sought out but much more rare is the cup and handle chart pattern. The cup originates with a spike high followed by a decline with rounded bottom and return back to the previous peak. A gradual price bottom developed over time is preferred over a sharp, quick “V” recovery.
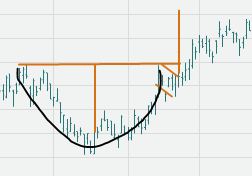
The handle is a flag attached to the bowl base. With the two components in place, the measured move target is the depth of the bowl distance added to the breakout above the hHandle. This measured move technique in the flag and cup and handle formations shows where to find the technical target.
Patience is crucial when using any chart pattern because it is important to wait until the formation is fully formed. Wait for the breakout/breakdown before pulling the trigger.