
“The trend is your friend,” they say, don’t they? Well, it is until the end of that trend!
Regardless of all the colloquialisms that refer to following a trend, you need reliable tools and a good method if you’re going to capitalize on trend following. It’s my humble opinion that there are two types of trends: The long term (which provides the most comprehensive information) and the short-term trend. The longer term trend applies to both day traders and “buy and hold” traders. The short-term trend, when combined with the longer term trend, is the most commonly used technique by most day traders.
So what are “the seven tricks” to following a trend? Read on my friends; it may be easier than you think and make sure you pay particular attention to Trick #7.
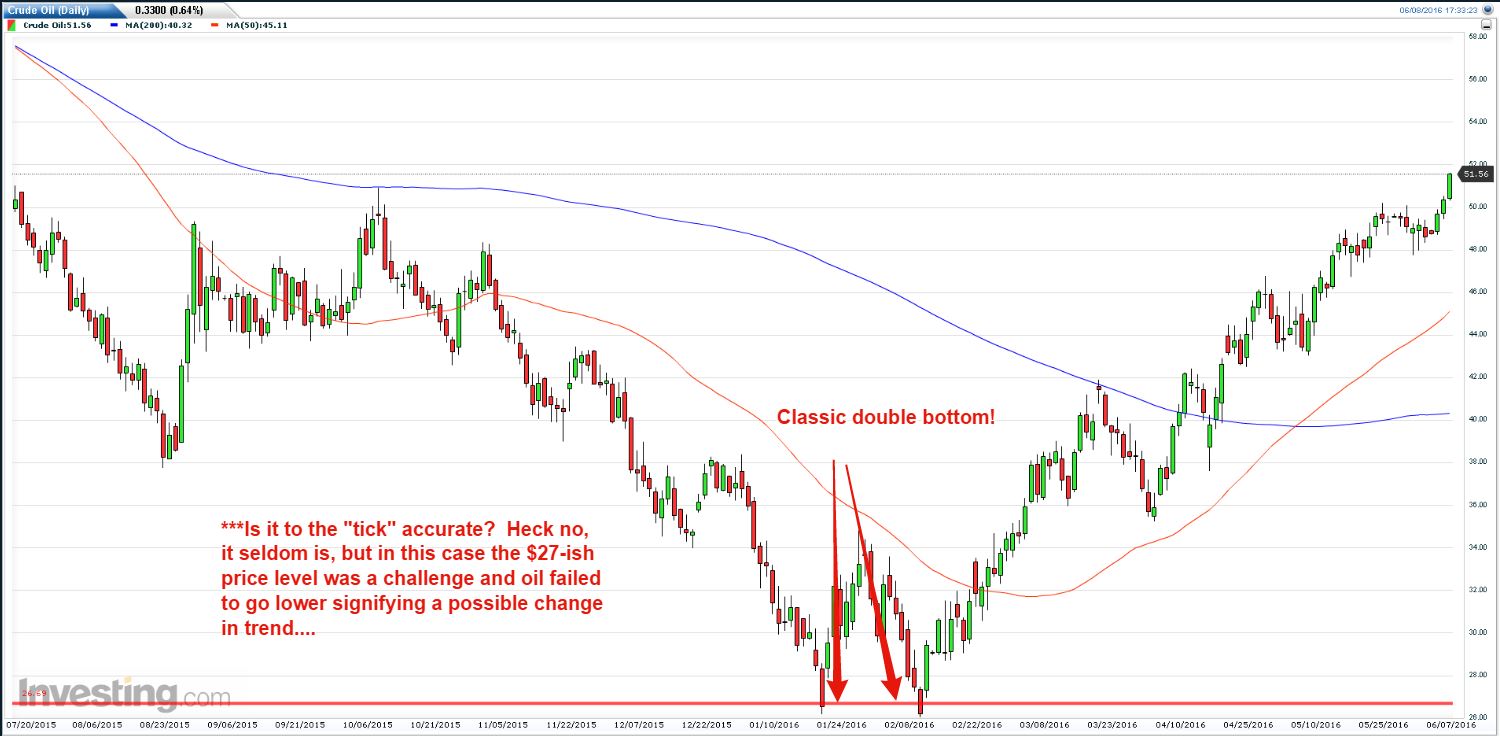
Trick #1 – Determine how to know “if” a new trend is even starting. First and foremost I need to inform you that it is my opinion that we need to use larger time frames; the definition of a larger time frame for this example is no smaller than a daily chart. Any smaller time frame will give a “false positive” regarding trend, true direction, and change in direction. To see if the trend is changing direction from one to another, I look for double tops and double bottoms like the chart below.
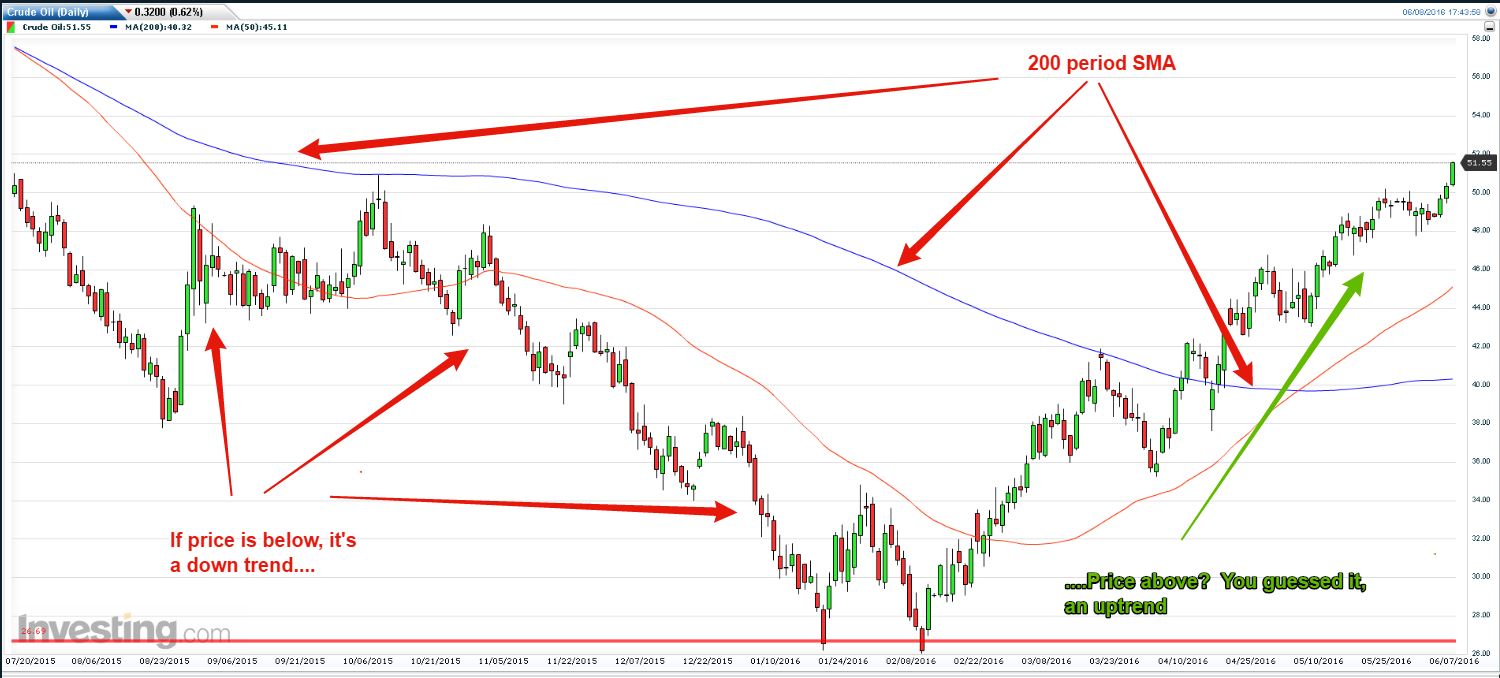
Trick #2 – Use simple moving averages. The 50 and 200-period simple moving average is what I like to use, but you can use whichever type you like such as an EMA, VMA. For the example below, I used the Simple Moving Average (SMA). For a downtrend, I look for price to be trading below the 200 SMA, and for an uptrend I look for it to be trading above the 200 SMA.
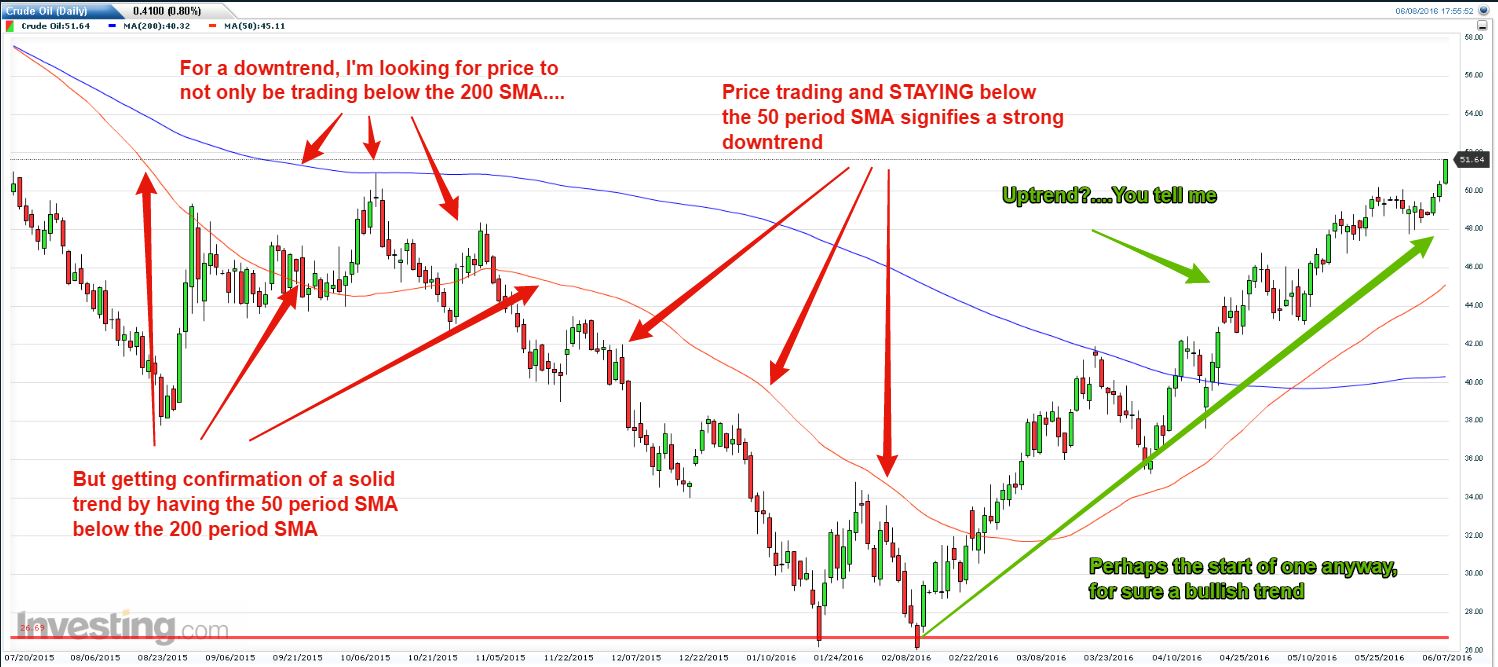
Trick #3 – Confirmation never hurts, that’s where the 50-period MA comes in. Simply put, a solid trend can be confirmed by the 50-period MA crossing over or under the 200-period moving averages. If the 50 period is above the 200-period, it provides confirmation of a bullish trend, and if it is below the 200-period MA, it can confirm a bearish trend.
Trick #4 – Keep your eye on the economy and world events; sentiment can surprisingly drive markets in a positive or negative direction for long periods of time. News and world events will play a part in the short term trend events as well; it’s amazing how an oil report, FOMC announcements, and the release of unemployment figures can force a strong bullish trend into a pullback (which many traders mistake as a change in trend, when in reality it is just a pullback, or “blip”).
We need to take a look at the short term, which ties in with the longer term that we’ve just discussed. In the Oil Trading Group’s (OTG) Live Trading Room, we are day traders that take the long-term, big picture into consideration. Given the examples that I’ve provided, according to “the big picture,” we appear to be in an uptrend given the fact that price is above the 200 SMA and the 50-period SMA is above the 200 SMA. That being said I have a bit of a bullish bias, but how do I take advantage of the trading opportunities while following the trend?
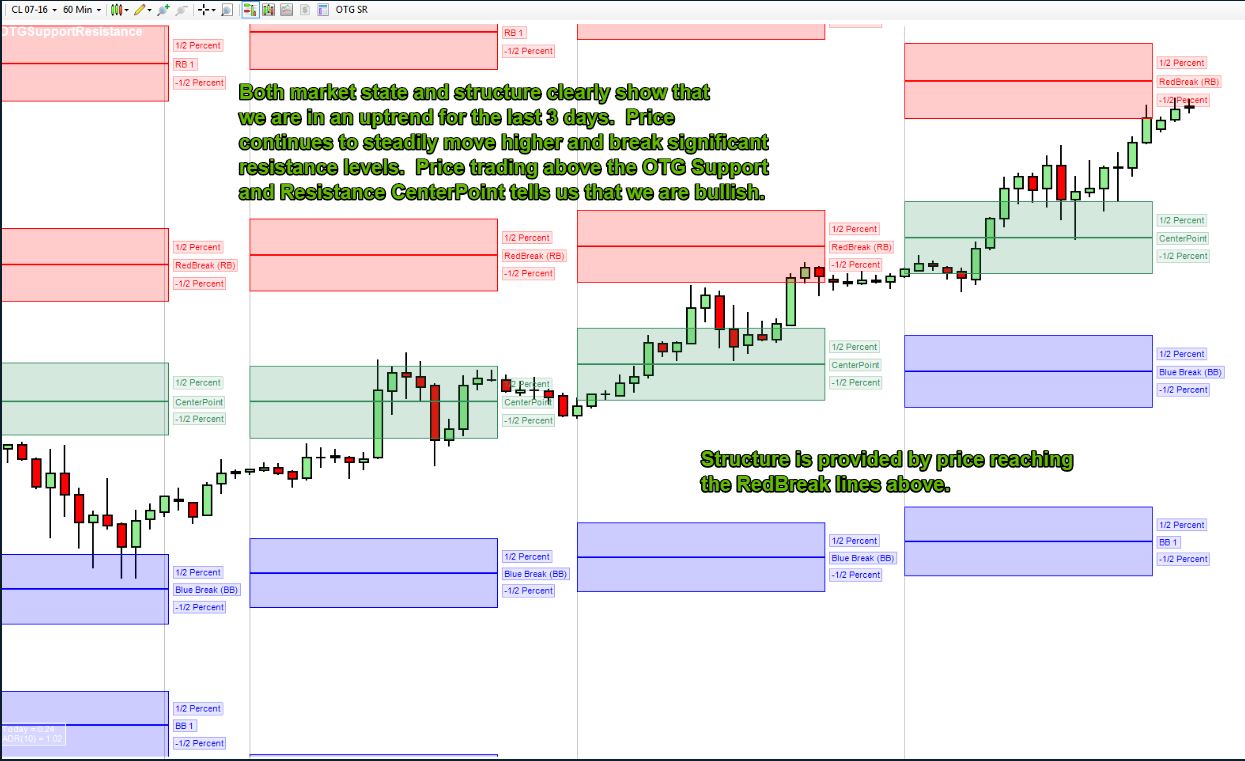
Trick #5 – Market State. Market state is simply looking at what the market is doing (so far) for the day in relation to what the overall big picture is. For example, if the current larger picture of the market says it’s bullish, is the day’s market moving up, down, or sideways? If it’s moving up (staying with following the trend), we may want to be taking breakout trades when price is reaching new highs or breaking resistance. Even if the market is moving down or is choppy, we may still want to look for long trades by using buy stops, or “fade trading.”
Trick #6 – Market Structure. Is price providing/breaking structure; or for lack of better words….is the market trending for the day?
Trick #7 – (drum roll please) is perhaps the biggest one so break out your pen and paper: Use common sense!!! All too often I have traders in the OTG Live Trading Room asking me why I am going long when they THINK the market is short. The fact is that the long-term picture provides me with a short-term strategy that helps keep me on track with following the trend. In a nutshell, if the long term picture shows that price is rising, I’ll have a bullish outlook. If the long term shows prices are going down…well…you guessed it, I’ll have a bearish bias; it’s just basic common sense.


