Bollinger Bands are one of the most popular technical indicators available to traders today. These bands can potentially identify overbought and oversold conditions, while providing the trader with a quick visual measure of market volatility.
Bollinger Bands consist of a moving average (the center line), with a line drawn above (+2 standard deviations above center line) and a line drawn below (-2 standard deviations below center line). While the parameters of the indicator may be adjusted to fit your needs, the standard setting is for a 20-period simple moving average to be plotted on the center line.
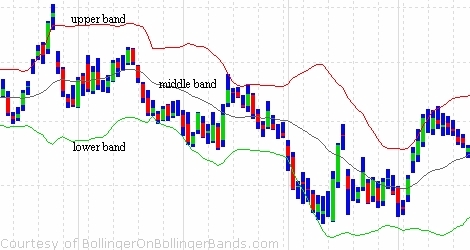
Generally speaking, a market may be overbought when it touches the top band, and it may be oversold when it touches the bottom band. This strategy looks to take advantage of that and to potentially profit from the market “correcting” itself back out of overbought or oversold territory.
Here’s how it works:
- Take a stock or group of stocks you trade and add Bollinger Bands to the daily chart using the traditional settings.
- If the market touches the upper band, look to establish a short position. If the market touches the lower band, look to establish a long position.
- Wait for a close outside the upper or lower band.
- Once a close outside the upper or lower band occurs, look to buy or sell the stock the next day on a return inside the band.
- Place a stop loss order just above or below the high or low of the bar or candle that closed outside the band.
- Manage the trade and look for a return to the center line (moving average) or even the upper band.
Bollinger Bands can in fact, demonstrate an extreme overbought or oversold condition. If markets begin to come out of such conditions, the moves can be fast and furious. In fact, sometimes such a move may turn into a full-scale reversal. Therefore, these types of trades may have very favorable risk/reward scenarios.
On the other hand, markets can and do stay overbought or oversold for long periods of time. Just because a market closes outside the upper or lower band, does not mean it’ll correct or reverse itself. Markets can see several consecutive closes outside the bands before the move has exhausted itself.
If trading multiple lots or multiple shares, you can also consider a “scale out” approach. For example, if you have entered a long position following a close below the lower band, you may consider taking part of your position off, if the market reaches the center line. The opposite cold be done for a short position.
As with any type of trading methodology, risk management is key. While a Bollinger Band strategy may potentially provide favorable risk/reward setups, it’ll also have trades that go against you immediately, and stay overbought or oversold for some time. That’s why it’s imperative to try to minimize losses on the trades that don’t work and to exit a losing position as soon as possible.
This strategy is simple, yet powerful and can potentially identify significant market reversals. If you’re not familiar with Bollinger Bands, check them out today. You may find them to be an important tool in your trading toolbox.


