A classic cup and handle chart pattern that appeared in the SLV Silver Exchange Traded Fund has achieved the measured move objectives in a textbook fashion.
The cup portion of this chart originates with a spike high followed by a decline with rounded bottom and return to the previous peak. A gradual price bottom developed over time is preferred over a sharp, quick “V” recovery.
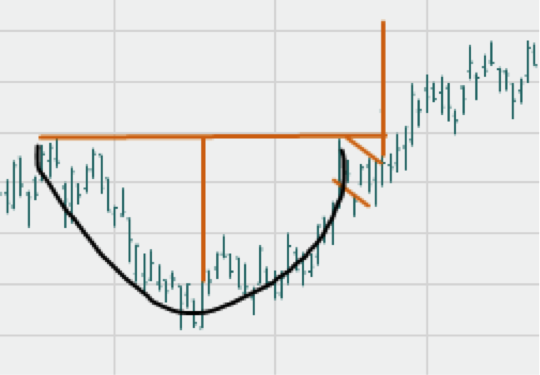
The handle part of this stock chart is a flag attached to the bowl base. With the two components in place, the measured move target is the depth of the bowl distance added to the breakout above the handle.
Patience is crucial when using chart patterns because it is important to wait until the pattern is fully formed. Wait for the breakout/breakdown before pulling the trigger. This measured move technique in the flag and cup/handle formations shows where to find the technical target.
A cup and handle is a price consolidation and continuation pattern that is bullish.
EXAMPLE: SLV ETF March 14th Setup
Silver, as viewed through the SLV exchange traded fund, had slid from recent highs near $50 to $13 lows in December. Bullish divergence with no new highs in volatility also strongly suggested a bottom was put in place.
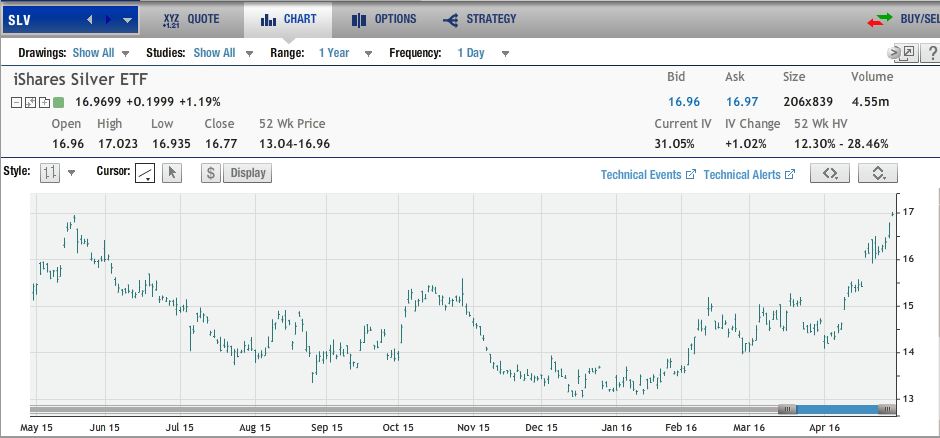
The technical pattern targets $17 which stands 15% higher than the current SLV price. Only close below the $13.00 recent low on the weekly basis would negate this bullish buying premise.
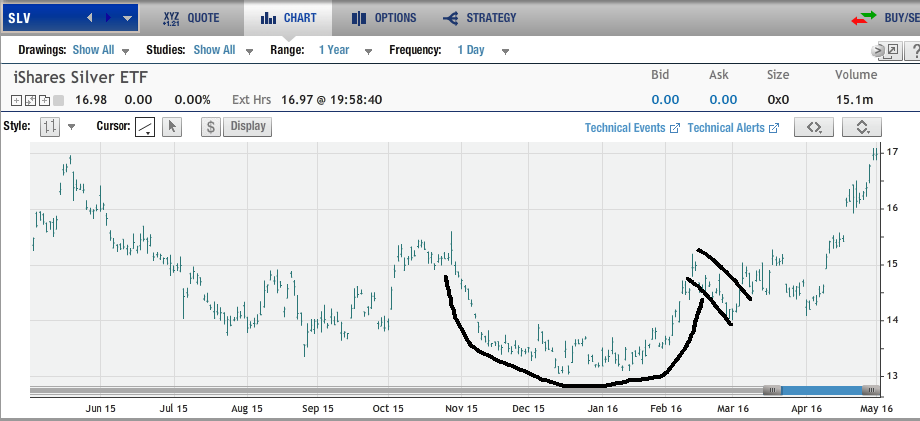
The move above $15 in March started the breakout run to the $17 target in six weeks. The SLV move was 13%.
Our BullsEyeOption.com service took advantage of the textbook formation by buying the in-the-money SLV $13 calls for $2. The SLV push to $17 doubled the option value with the exit at $4 for a 100% gain.


