Cut Out the Noise!
While trading indicators can be useful, they are by no means a Holy Grail. In fact, traders will often rely on indicators too much. “Indicator overload” can lead to poor results, lack of decision making and conflicting signals.
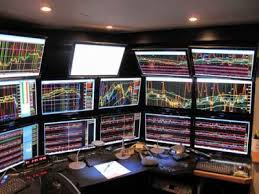
If your trading space looks like this, you may be suffering from information overload…
Most widely used indicators are lagging indicators-meaning they are telling us about price action that has already occurred. If you consider this for a moment, how does the past help us make trades in the future?
Spoiler Alert: It doesn’t…
While indicators may be good for smoothing data, the only thing that matters is price.
If you go long and prices rise, you make money…
If you go short and prices decline, you make money…
If you go long and prices decline, you lose money…
If you go short and prices rise, you lose money…
Price action is the only pure, real-time indicator that exists. Price action should be the center of your focus, not a bunch of squiggly lines on a chart.
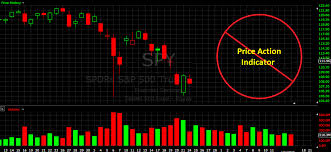
The chart above is clean and crisp. It simply shows price action on top with volume on the bottom. Just by looking at this chart, one can see which direction prices are trending and where potential areas of support and resistance may be.
Trading is, after all, a game of buying support and selling resistance.
Price action trading is commonly used by floor traders and tape readers. Price action can be used with chart patterns and volume to formulate trading strategies independent of other indicators.
The use of a candlestick chart can also potentially be beneficial. A candlestick simply gives a clear visualization on price action as it develops. For example, a 30 minute candlestick closing in the top end of its range may be indicative of current strength. On the other hand, a daily candlestick trading near the bottom of its range may be indicative of weakness.
Price can do one of three things:
- Go up
- Go down
- Go sideways
That’s it…
Forget about all those fancy lines and oscillators on your chart for a while. Focusing on price action can potentially get you more in tune with the markets and may potentially lead to better results.
Do not let indicator overload cloud your judgement. Focus on price action and price action only.
And above all else: KISS. (Keep it simple stupid).


