
In an earlier post, “Anticipating Turning Points,” I established that it is far better to anticipate the reversion to the mean using oscillator indicators rather than waiting for confirmation. There will always be lag in computing the indicator, and it is not uncommon for the lag to be almost as long as the expected trade duration.
If one waits for confirmation, the lag places the trade on almost the exact wrong side of the trade, but this can be mitigated by anticipating the indicator turning point rather than waiting for confirmation of the move.
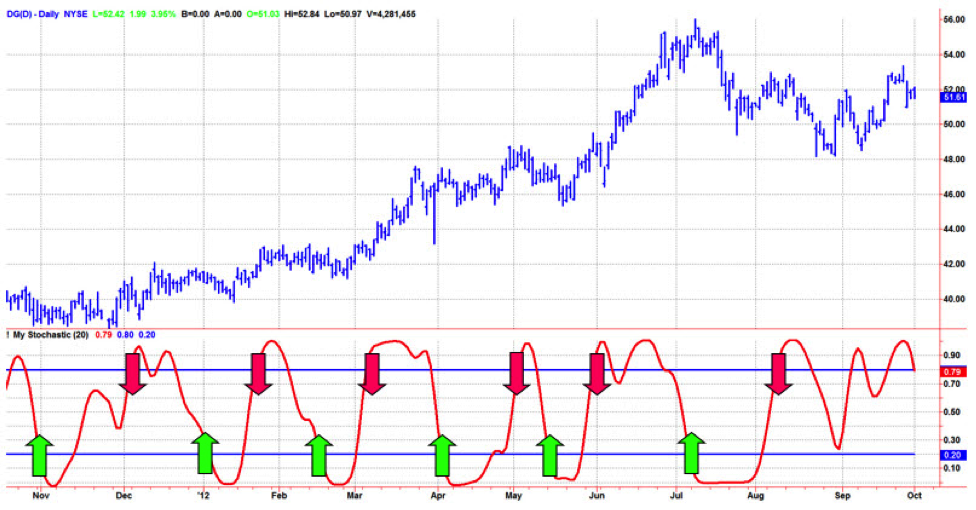
This trading strategy for improved performance is demonstrated in the chart below. A buying opportunity occurs when the indicator crosses under the 20% level, as shown by the green arrows. Crossing under the 20% level always precedes the indicator turning point, and more often than not, provides the correct timing to enter a long position.
Similarly, a selling opportunity occurs when the indicator crosses over the 80% level, as shown by the red arrows. This commonly is the best time to exit an existing long position and to initiate a new short position.
So What to Do if the Reversion to the Mean Strategy Fails?
There are obvious cases where the reversion to the mean strategy fails. Failure occurs because the price turning point is anticipated, but the turn doesn’t materialize, and the price keeps on going in the direction of the trend.
Several examples can be seen on the chart above. In this example, the strategy would have a trader sell short at the third red arrow from the left. However, the prices just keep going up! Similarly, the prices just keep falling after the last green arrow on the right.
One technique to combat this would be to use a stop loss—but to significantly reduce the amount of the loss a little more elegant technique can be employed.
Notice that when the reversion to the mean strategy is successful, the indicator does not remain above the 80% level or below the 20% level very long. On the other hand, the strategy failures occur when the indicators remain outside these limits.
The Easiest Way to Tell If the Mean Reversion Strategy is Likely to Fail
In fact, the duration the indicator spends outside the limits is approximately one-quarter of the cycle period in the market. For example, if the market has a monthly period of 20 trading days, you would expect the indicator to remain outside the 20% and 80% levels five days or less.
Staying outside these levels longer than five days would be a sign of the indicator value, and the better strategy would be to exit the current trade or reverse your position, thereby betting on the failure.
Trading performance can be further enhanced by making adjustments to the indicator that take advantage of the spectral content in the market data. To see how this can be done, click [HERE].


