
The art of short-term trading is far different than intermediate to long-term investing. The goal for short-term traders is to find quick and immediate moves, up or down, in the market that they are trading.
That means things such as fundamentals, long-term cycles, commitment of trader report seasonals and so many other things have little bearing on what drives markets on a very short-term basis.
Which raises the question… “What causes short-term market moves?”
I certainly don’t have all the answers to this question but my trading experience has taught me a few things I would like to share with you today.
The most certain influence of short-term patterns is what mathematicians call mean reversion. Traders would refer to this as overbought/oversold readings in the marketplace. When the market gets pushed down so much over the last few days it has a natural tendency to bounce back… in other words, revert to the mean.
By the same token when it’s rallied strongly for a few days it’s entitled to pull back.
That’s the theory but how can one put this theory into application?
Certainly, the people running trading programs at WorldCupAdvisor.com understand this phenomenon; all of us have tried to take advantage using many different techniques.
Here’s one technique that I have found helpful:
When looking for a buy signal I would like to see a combination of things… not just an oversold reading. I think there is a huge difference between oversold readings in an uptrend market and oversold readings in a downtrend market. By the same token, an oversold reading that comes at the time of the seasonal low or when the seasonal trend calls for an uptrend is much more important than an oversold reading with the opposite condition.
In other words, traders can filter overbought and oversold readings with other conditions. Among those conditions would, of course, be:
- trend
- seasonal influences
- and accumulation distribution
You may refer to that as on-balance volume (OBV) or my own unique blend of price, open interest, and volume (POIV) all into one measure of accumulation. Many other people have also developed their own unique accumulation techniques which you could also use.
The following chart shows an example of this type of an approach to filtering trades. Here we are looking at a chart of the US Dollar Index. As you can see the seasonal pattern, the light blue line, is in a downward direction telling us that, in the past, the US Dollar Index has usually declined from July into September.
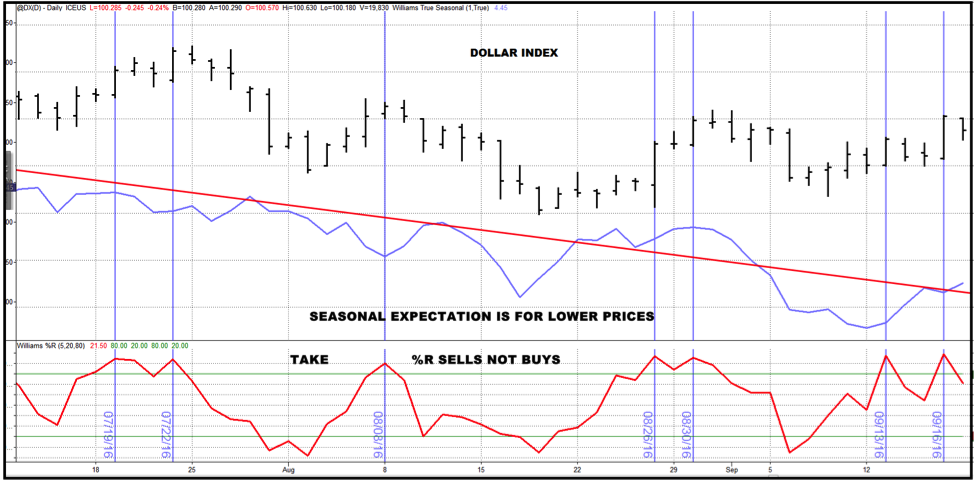
A chart of the US Dollar Index.
If that’s the case then why buck that seasonal trend? Instead of taking buy signals during this time, we could take sell signals. This means you would trade whenever an overbought/oversold indicator, such as my Williams % R, gets into the overbought area, then we would like to take sell signals as I have marked off. Buy signals would be passed or taken only if they had an additional filter to ensure accuracy.
The bottom line is it’s not just enough to have an overbought oversold reading… that’s the beginning.
To make it work you need another condition, or two, to substantiate that this time the oversold reading should, in fact, trigger a good market rally that you, as a short-term trader, can take advantage of.
For additional trading tips from Larry Williams click here.


