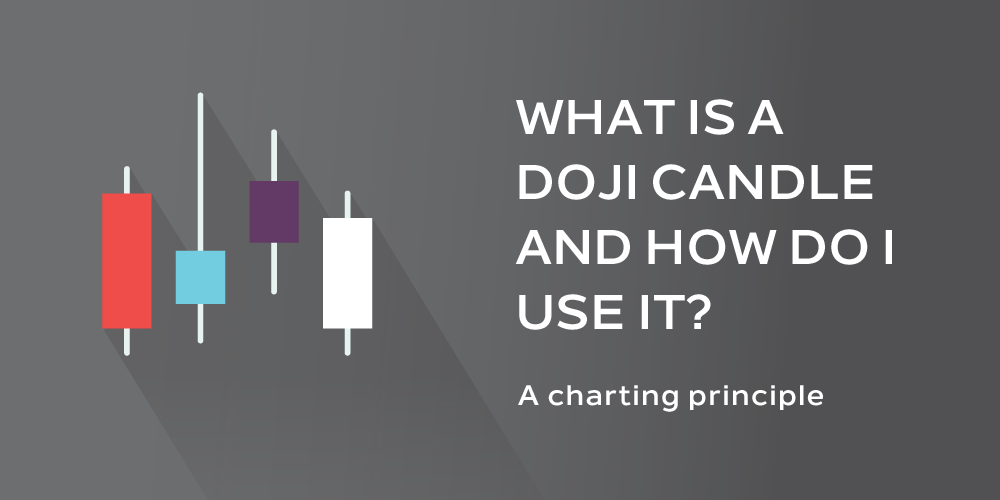
The Doji candle is one of the most useful candlestick patterns used by traders and investors. It consists of a candle in which the opening and closing price are equal, or very close to it. While the wicks of the candle (the high and low) may vary in length, the open and close are virtually the same, thus giving the candle a cross-like appearance.
In fact, Japanese candlestick charting got its start in the 17th century. These charting principals illustrate movements in price. The ‘why” of price movement is considered irrelevant.
Candlesticks show the period’s opening price, closing price, high price and low price in an easy to read manner.
What Does an Identical Opening and Closing Price Mean?
To sum it up: indecision.
The Doji is considered a neutral candle as neither the buyers nor the sellers exhibited control. In other words, the buying was matched by the selling, and vice versa. The importance of such a pattern depends on the preceding price action and overall market context.
For a market in an uptrend or downtrend, the Doji may be a sign of a potential reversal. As markets reach possible turning points, the level of indecision may increase and thus additional Dojis may be seen. In addition, other potential reversal patterns may also be seen containing Doji candles.
What Should I Do?
If you have been riding a trend either up or down and a Doji candle is formed, it may potentially indicate a reversal. You may want to consider lightening up on the position or exiting. If you hold the position, you should be on the lookout for further reversal activity.
If you are looking to enter a market, a Doji may be used as an entry point. If you are looking to get long on a market that has been moving lower, you could consider buying once price breaks above the high of the Doji candle. The opposite could be done if looking to enter a short in a market that has been moving higher.
The Doji candle is by no means the Holy Grail of trading. This candlestick type can provide potential clues as to market sentiment and possible turning points. Dojis are most effective when used along with other forms of technical analysis including support and resistance levels, oscillators and chart patterns.


