I hate being right on shorts. Don’t get me wrong; my job is to find winners on both sides of the market for my members, but when shorts play out correctly and drop, it always leaves a bad taste in my mouth as I’m a die-hard bull trader.
That being said, the TSLA short I called at $230 here on TraderPlanet in August is now breaking through $200, less than 30 days later.
How did I know this was going to drop?
As I outlined a month ago; one thing any trader has to do is to examine the macro picture. We do this every night before sending out updated watch lists and videos to members and the one thing we’ve seen recently is a psychological exuberance at the new all-time highs, but also a lack of fundamental and technical support that justifies those highs.
The steps to finding our swing trade positions and forecasting stock prices are simple, but the algorithms and scans are complex. Really, it boils down to the following steps:
- Determine market direction first
- Run scans to get general universe of stocks
- Start to manually chart technicals to see setups
- Narrow down list based on criteria
- Determine risk-reward and price levels (check out my first post – Trading Rule #1: Use the Risk-Reward Ratio)
- Determine capital to allocate
- Wait for market and price action to go live with trade
When I looked at the DOW back in mid-August it was clear to me the market was due for a pullback due to the way the technical indicators such as the 13ema, 20ema, W%, and RSI were shaping up. Here was the chart from back in August.
After running the short scans our team and members use we found TSLA as a perfect setup.
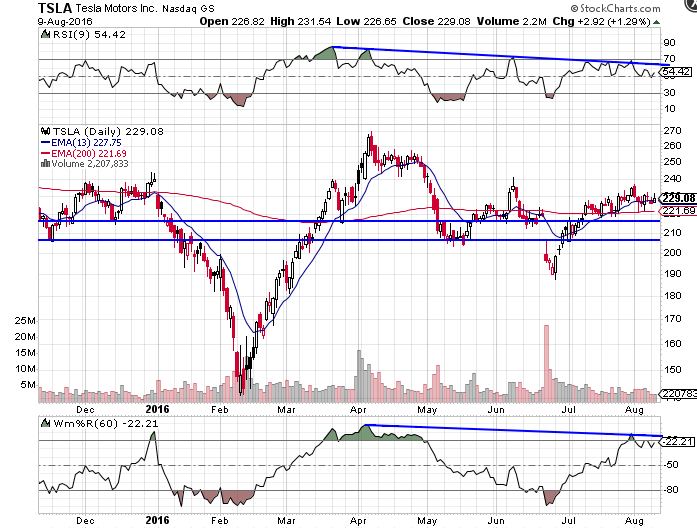
For starters; we saw a failure to break into new price highs through the early summer. This was very telling as $240 failed and then $235 in June and August and the general market failed to make new highs as well.
Second, new indicator highs were never eclipsed in both RSI and W% when comparing the indicators’ prior highs in April 2016. This told us there was inherent weakness and resistance at much lower price levels and that sellers were still there at significant levels.
Third, the trend in all three (price, W%, and RSI) were all down versus that high in April along with the average daily volume. Volume was the key thing to look out for at this stage of the analysis.
And finally, the 13EMA was continuously being tested and breached over the 7 trading sessions leading up to us going short along with the 200EMA. This continued testing of the 200EMA was troublesome.
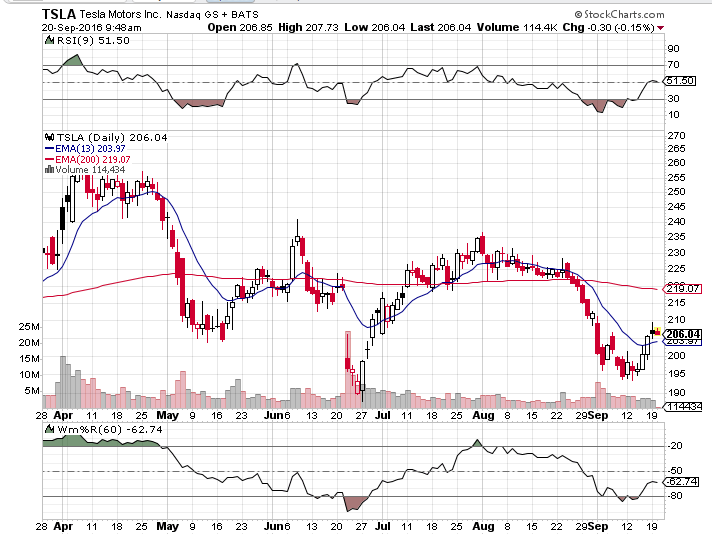
After watching TSLA then collapse to $200 covering for a 15% return in 30 days would have resulted in outperforming the DOW, SPX and Russell substantially in the same timeframe.
The takeaway: following our simple rules, and detailed scans, would have resulted in a 15% return in under a month. Our system continues to find winners like this and we’re on our way to another successful and profitable year.